Graphing the Great Gun Debate in a White Supremacy System
/The U.S. has an estimated 283 million guns in civilian hands, the equivalent of nine guns for every 10 people in America —the highest rate of gun ownership in the world. That is more than the 254 million cars, trucks and motorcycles registered in 2009. [MORE] BW has noticed that Governments, social scientists and the people who pay them rarely provide data on US gun ownership by "race"... which is interesting since everything else gets broken down by white people like this. Our research has found that whites possess roughly 89% of all these guns. [MORE] and [MORE]

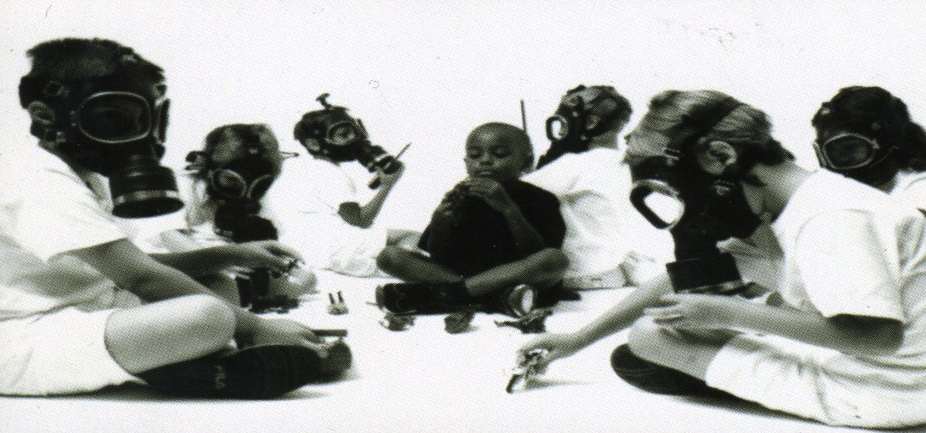
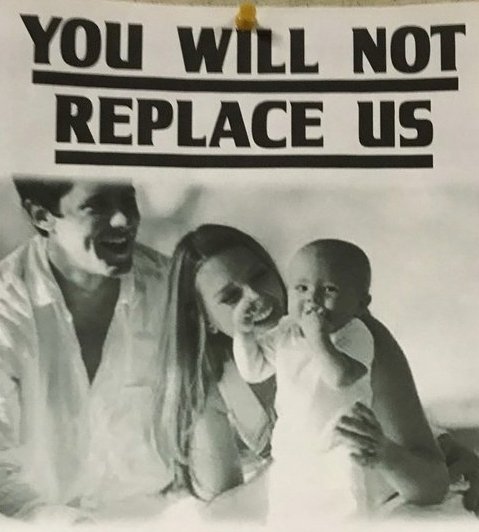
White people are preoccupied with weapons. These weapons surround all of the world's non-white people. [more] About race and the gun control debate Michael Moore recently said “I think we’re [white people] a very frightened people,” [MORE] The world is 90% non-white and the white population is declining. Perhaps whites hope that the weapons will prevent white genetic annihilation and thereby ensure white genetic survival? [MORE] and [MORE].
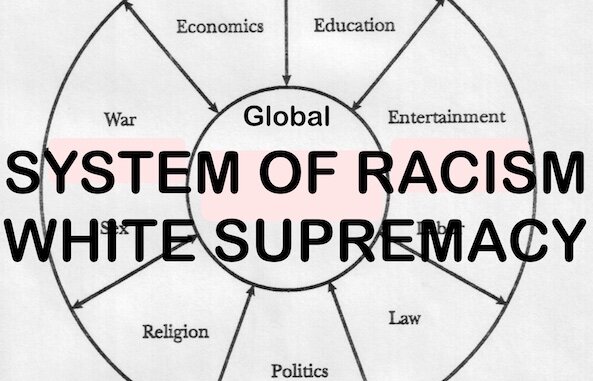
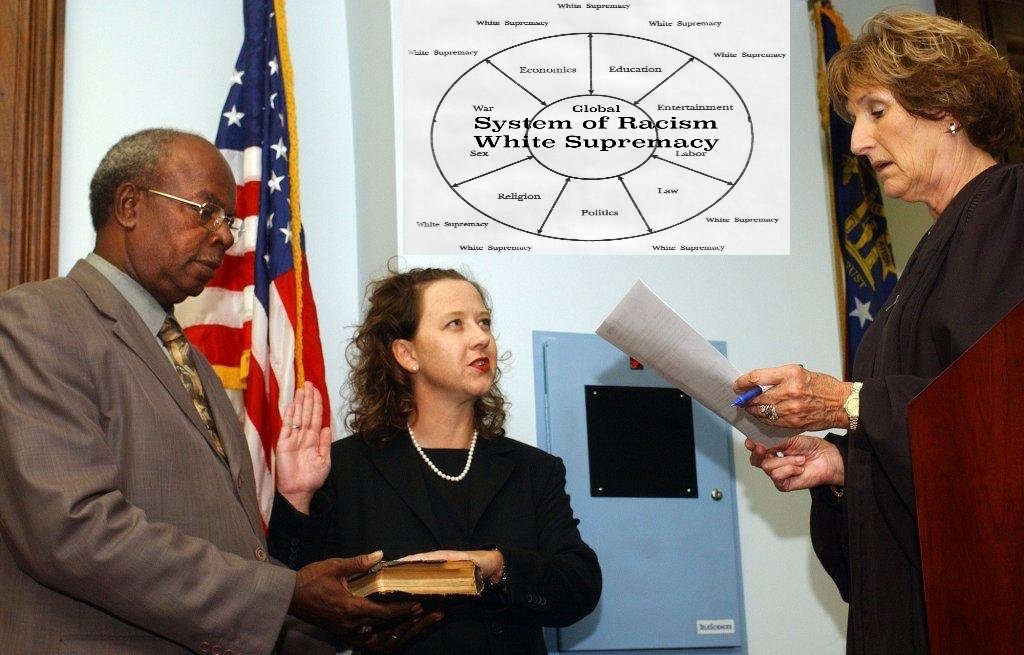
The Refinement of White Supremacy Graph (Black on Black murder) [more]
According to the Children's Defense Fund, "the result of so many guns and weak federal and state guns regulations is an unacceptably and disproportionately high rate of gun deaths. Gun death rates in America are more than seven times higher than they are in the other high-income countries. Although current gun regulations impose restrictions on purchases by teenagers, convicted felons, and people with a history of severe mental illness, they contain loopholes that limit overall effectiveness. For instance, the Brady Act requires licensed gun dealers to conduct background checks on all purchasers but exempts private sellers." (Nevertheless, D.C., which has some of the Nation's strictest gun control laws has the highest rate of gun homicides per 100,00 people.[more])
- Between 1979 and 2009 gun deaths among White children and teens have decreased by 44 percent, compared to an overall 30 percent increase among Black children and teens over the same period.
- Black children and teens accounted for 45 percent of all child and teen gun deaths in 2008 and 2009 but were only 15 percent of the total child population.
- Black males 15-19 were eight times as likely as White males of the same age and two-and-a-half times as likely as their Hispanic peers to be killed in a gun homicide in 2009. The leading cause of death among Black teens ages 15 to 19 in 2008 and 2009 was gun homicide. For White teens 15 to 19 it was motor vehicle accidents followed by gun homicide in 2008 and gun suicide in 2009.
- The number of Black children and teens killed by gunfire in the 30 years since 1979 is nearly 13 times greater than the number of recorded lynchings of Black people of all ages in America in the 86 years between 1882 and 1968. [MORE]
The following graphs were compiled by Propublica [HERE]

Tracing the national flow of guns, Washington Post, October 2010
A 2010 graphic from The Washington Post shows how "states with strong gun laws import [guns] from states with weaker laws." The map uses 2009 data of firearms recovered by police.
Where 50,000 Guns Recovered in Chicago Came From, New York Times, January 2013There have been nearly 50 homicides in Chicago already this year, despite some of the strictest gun ordinances in the country. So where are the guns coming from? This New York Times map traces the origins of 50,000 guns recovered by police from 2001 to March 2012.
Gun laws and politics:

Gun laws in the US, state by state, The Guardian US, December 2012
Any conversation on regulation is complicated by the huge variation in gun laws from state to state. This Guardian US interactive lays out regulations by state, from concealed handgun laws to background checks.
Where Congress Stands on Guns, ProPublica, January 2013Do you know where your representative stands on gun control? This chart details NRA and ratings and contributions, Brady scores and votes on the 1994 assault weapons ban.

Gun Rights Campaign Contributions, Slate, January 2013
Find out how much gun rights advocates donated to members of Congress in the last election cycle.
How the NRA exerts influence over Congress, Washington Post, January 2013The Washington Post visualizes which members of Congress "get the most--and least--support" from the NRA.
This is Your Representative on Guns, The Daily Beast, February 2013Input your address and get an overview of your representative’s positions on gun control as well as NRA contributions for each. The Daily Beast is also aggregating gun-related tweets by politicians at @YourRepsOnGuns.
Gun violence:

Long Weekend of Gun Deaths, NBC News, January 2013
A tick tock of gun deaths over the MLK holiday weekend details incidents by type, including accidental shootings, murders, police shootings, self defense and suicide.
Gun Homicide Rates, The Washington Post, December 2012A detailed look at firearm homicides across the United States and around the world.

The U.S. Shooting Epidemic, The Daily Beast, July 2012
The Brady Campaign to Prevent Gun Violence estimates a multiple-victim shooting happens once every 5.9 days in the U.S. That totals at least 431 such shootings since 2005. The Daily Beast mapped the Brady Campaign’s data to see where such violence occurs.
America Under the Gun, Mother Jones, December 2012Over 140 people were killed or injured in seven mass shootings in the U.S. last year. As part of a special report, Mother Jones compiled a series of graphics on the victims of mass shootings, and the spread of looser gun laws across the country.

U.S. Gun Crime, The Guardian, December 2012
Gun laws vary across the country, but how much difference is there in gun crime? The Guardian has a state-by-state comparison, charting stats including firearm murders as a percent of all murders, and the number of gun robberies per 100,000 people.
How Many People Have Been Killed by Guns Since Newtown?, Slate, January 2013So far, Slate has recorded at least 1,795 victims of gun violence since the morning of December 14th, the day of the Sandy Hook shooting. Slate is also crowdsourcing gun death reports on Twitter with @GunDeaths. As they point out, “the data is necessarily incomplete,” but they attempt to give a name to each recorded victim.


