Annual report from the U.S. Census Bureau: The Poverty Rate for Blacks is Three Times Higher than Whites
/From [HERE] When it comes to income and health insurance coverage, the average U.S. household is doing about the same as it was last year — but today’s annual report from the U.S. Census Bureau confirms that we are living in a time of historic income inequality.
Households in the 95th percentile (whose incomes exceed those of 94 percent of U.S. households) earned an average of $196,000 in 2013, while those in the 10th percentile brought in only $12,400. The median household: just $51,900.
Examining this data since 1967, when the Census Bureau began measuring real household income — just a few years into then-President Lyndon B. Johnson's War on Poverty policy initiatives — incomes for the bottom half of Americans have stagnated, while those of the top 10 percent have enjoyed a more than gradual ascent, particularly since the late 1980s.
The most commonly used measure of income inequality, the Gini ratio or Gini coefficient, has surged since 1967, from 0.36 to nearly 0.46. (This index ranges from 0 — representing a state of perfect equality, where everyone has the same amount of resources — to 1, a state of absolute inequality in which one individual owns everything). South Africa is among the world's most unequal countries, with a 0.63 ratio. Sweden among the most egalitarian, with a 0.23 ratio.
Today's census data reveal other disparities as well. For example, in 2013:
- The average full-time female worker earned just $0.78 for every $1 paid to a comparably employed male.
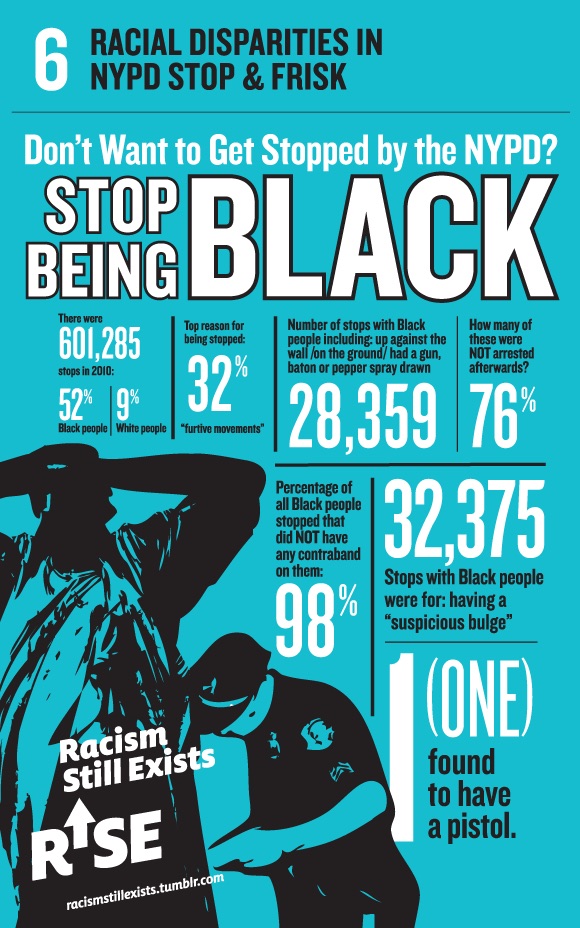
- The poverty rates for blacks (27.2 percent) and Hispanics (23.5 percent) far surpassed those of Asians (10.5 percent) and non-Hispanic whites (9.6 percent).
- Children (19.9 percent) and working-age adults (13.6 percent) were far more likely to live in poverty than those 65 and older (9.5 percent), many of whom qualify for Medicare and Social Security.
- On the flip side, thanks in part to public health insurance programs for minors, children were much more likely to have health insurance than working-age adults. Just 7.6 percent of children were uninsured, compared to 18.5 percent of adults under 65. Since the implementation of the Affordable Care Act in 2010, the overall rate of uninsured has dropped from 15.5 percent to 14.5 percent.